Test subjects
Participants from this study were from the Northern Colorado area and were broken into two groups: those with an osteomyoplastic reconstruction (n=7) and a healthy control group (n=9). The amputee group was 1.78 ± .08m and 84.1 ± 16.9kg. The control group was 1.7 ± .7m and 71.11 ± 10.14kg. Those participants in the healthy control group had no known functional impairments. Participants came to the University of Northern Colorado in Greeley into the biomechanics laboratory in Gunter Hall or to the University of Denver biomechanics laboratory.
Measurements & markers
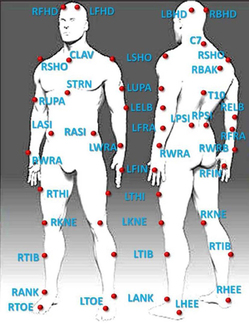
When they arrived at the lab, participant’s height and mass were measured, followed by several anthropometric measurements. A calliper was used to take wrist width, knee width, ankle width, and these values were entered into the Vicon Nexus 1.8.5 computer system. The Vicon system and force plates were then turned on and calibrated. Ten cameras were used by the Vicon system to track each subject’s transitions. Each camera was angled in various locations around the room, all angled downward towards the force plates. A tape measure was then used to measure leg length and fibular head height for both right and left sides. These values were also entered into the Vicon computer system. Forty-one reflective markers were then placed on the subject. The placement of these can be seen in the diagram on the left. The following is a list of landmarks where markers were placed: four markers on the head; one marker on the right and left shoulder, upper arm, lateral elbow, lateral forearm, medial and lateral wrist joint, and on the 3rd metacarpophalangeal joint; one marker on the C7, the right back, and the T10; one marker on the clavicle and sternum, right and left anterior and posterior superior iliac spine, right and left lateral thigh; medial and lateral knee joint, lateral tibia; medial and lateral ankle, heel, and toe. When placing markers on the tibia, thigh, forearm, and upper arm, the right side must be lower than the left in order for the Vicon system to function properly. The locations are used because they are easy areas to locate, repeatable, and correspond with the anthropometric measurements. This allows the computer to build an accurate model of each subject.
trials
The chair was adjusted to each subject’s fibular head height and placed behind the two force plates so that when the subject was sitting, one foot was on each force plate. The chair used had no armrests.
When each amputee subject (n=7) came in, they began by standing and were then told to sit and stand as quickly as possible five times. Each subject was instructed that they could not use their hands for extra support or to push off. This same process was completed for each healthy control (n=9). The Vicon system and force plates collected the data from each STS transition in one file. The cameras captured video data at 100 Hz and the force plates captured data at 2000 Hz.
When each amputee subject (n=7) came in, they began by standing and were then told to sit and stand as quickly as possible five times. Each subject was instructed that they could not use their hands for extra support or to push off. This same process was completed for each healthy control (n=9). The Vicon system and force plates collected the data from each STS transition in one file. The cameras captured video data at 100 Hz and the force plates captured data at 2000 Hz.
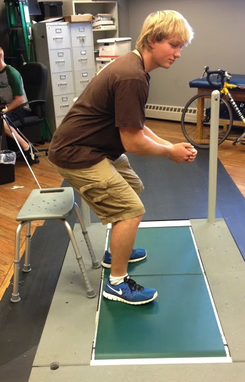
My peer Dylan demonstrating what a typical trial looks like. He has one foot on each force plate and is not using his hands to assist him during the transition. The chair is set behind the two force plates.
data analysis
Once the trials were complete, the data was compiled on to spreadsheets for each subject. The data for knee joint angle was made into a graph to find the middle three STS transitions. The maximum and minimum joint angle was found for each transition and averaged. The minimum value was subtracted from the maximum value to find the range of motion (ROM) and then the average range of motion was calculated. This process was repeated for the left and right side of the hip, knee, and ankle joints. Corresponding frame times for each transition were located in the center of pressure (COP) data. For each transition, a range was calculated for both the x and y axis.
The average joint angles and center of pressures for each amputee (intact leg and amputated leg) was compared with the average joint angles and center of pressures for each control subject using measures ANOVA (SPSS, 20.0, alpha = .05). During data analysis, only the left side of the control group was used for comparison as the controls were assumed to be symmetrical.
The average joint angles and center of pressures for each amputee (intact leg and amputated leg) was compared with the average joint angles and center of pressures for each control subject using measures ANOVA (SPSS, 20.0, alpha = .05). During data analysis, only the left side of the control group was used for comparison as the controls were assumed to be symmetrical.
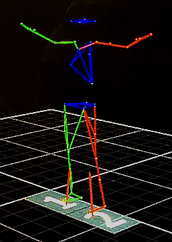
Above is an image of the Vicon system's reconstruction of a subject in the computer.
